
Implementing CONNECT solutions is a basic step toward transforming your operations into a Smart Factory. The extensive features and benefits of the system are all- inclusive.
SpencerMetrics’ customer-centric design approach allows us to continuously add relevant features and updates that add value for all users at no additional cost (Yes, updates are free!)
Analyze people, processes, and equipment to optimize operations
Revolutionary technology efficiently integrates machine and shop floor data collection. Real-time analytics pinpoint opportunities for improvement.
Multi-vendor and multi-technology solution to connect with a variety of digital and analog devices across production platforms.
Improve utilization and profitability. Conduct more business to make more money with your investments in equipment, labor, and overheads.
Secure and scalable architecture serves a variety of manufacturing environments. View your production data and analytics in real-time anytime, anywhere.
DESIGN has always been a fundamental principal in the development of CONNECT
“Design Is The Primary Mover That Gets You From A Basic Technology To Something That Is Usable By A Human Being”
– Maria Yang, Associate Dean of the School of Engineering, MIT
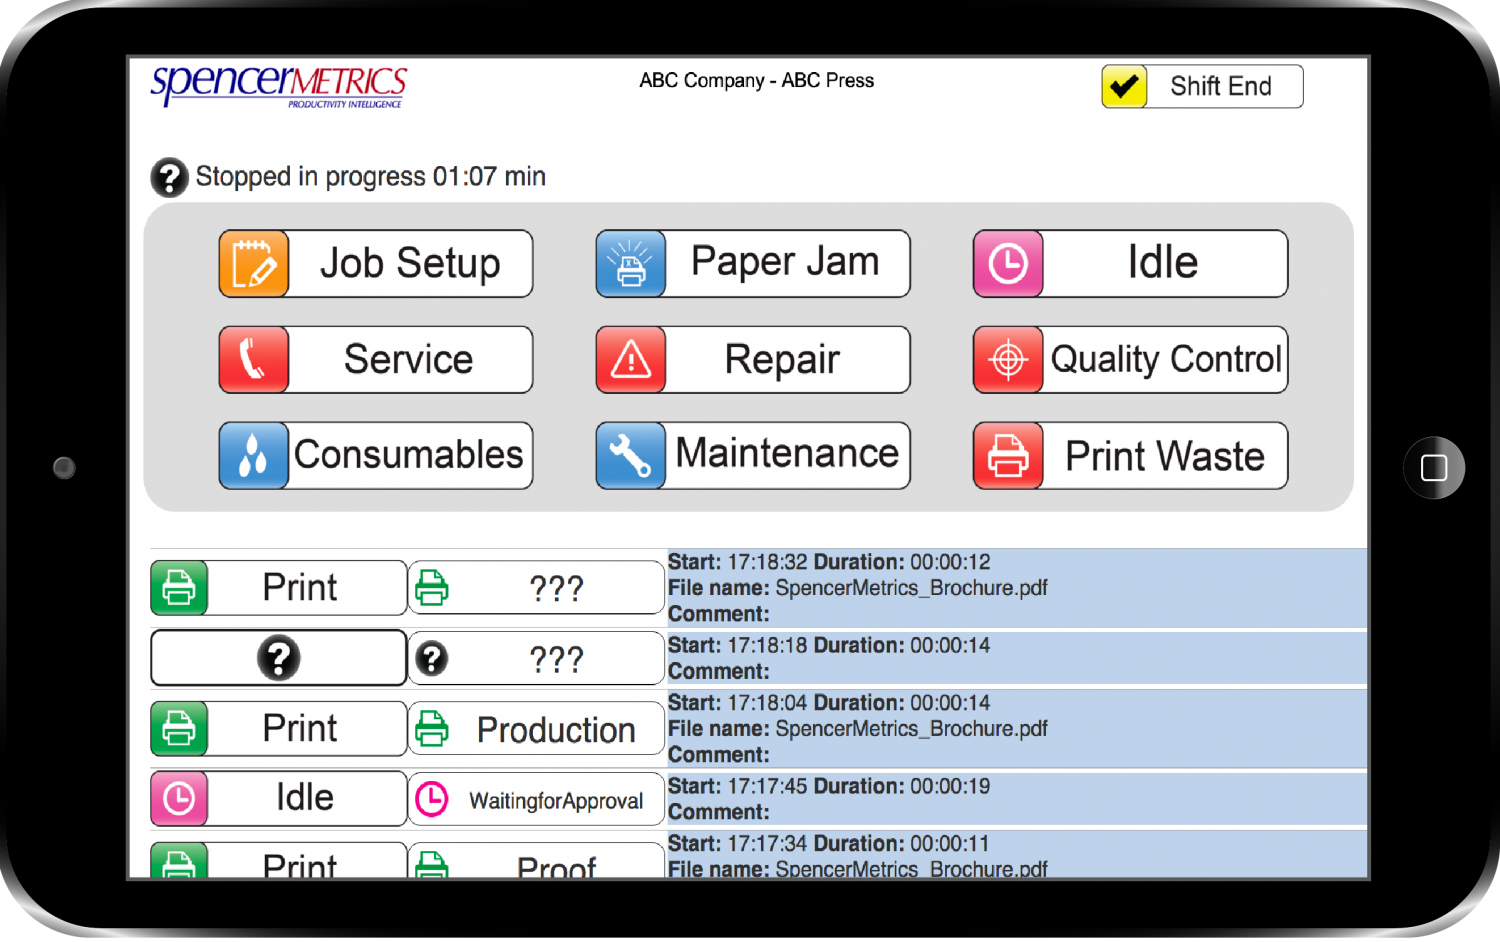
The integrated two-touch Shop Floor Data Collection terminal provides a breakthrough design in collecting data from machines and operators without adversely impacting productivity. As machine uptime and downtime is automatically collected and logged, operators can take care of the problem first and come back at their convenience later on. They simply choose from downtime options on the terminal, customizable for you and your company’s needs.
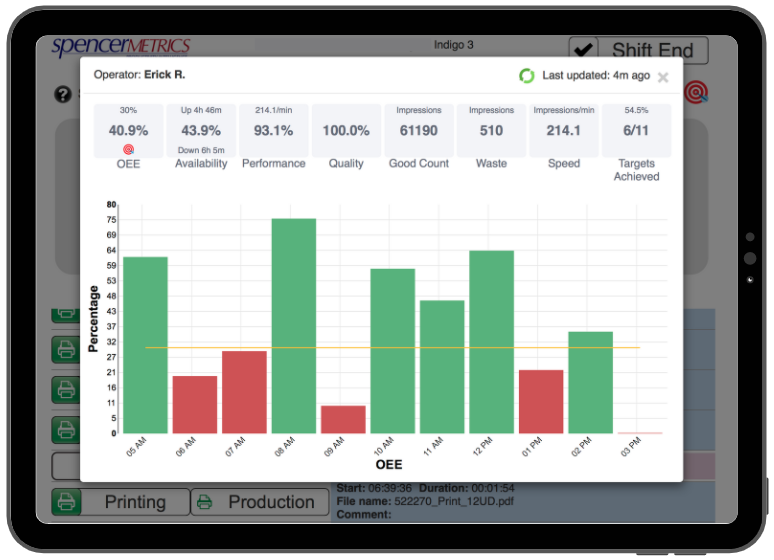
With the Operator Dashboard, employees on the shop floor can visualize and measure their own progress, keeping operators engaged and motivated throughout their shift.
The multi-lingual interface offers one of the easiest ways to collect accurate, relevant, and vendor-neutral information that can be analyzed in real-time to pinpoint opportunities for improvement. Use the Operator Alert feature on the system to remind employees about scheduled maintenance tasks.
Simple, yet powerful analytics allows your business to identify excessive downtime activities that bleed valuable production time. A robust feature set allows for deep-dive analytics to determine root causes of loss profits. Track KPIs (Key Performance Indicators), such as OEE, Utilization, Counts, Consumable Usage, Operator and Equipment Performance, and more. Compare work periods, shifts, devices, locations and benchmarks. Automatic job analysis provides accurate information about the actual time and resources required during production for each job.
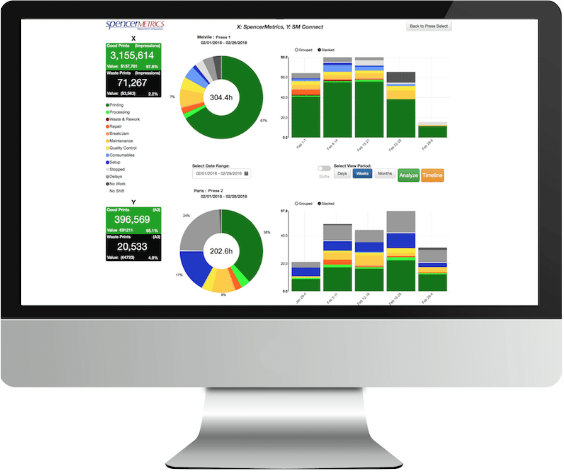
Maximize overall productivity, reduce costs, and improve utilization with real metrics using intuitive dashboards and comprehensive graphical displays of analyses. Set up daily, weekly, or monthly automatic reports. All analytics and data are available for export; API allows integration with other MIS/ERP systems.
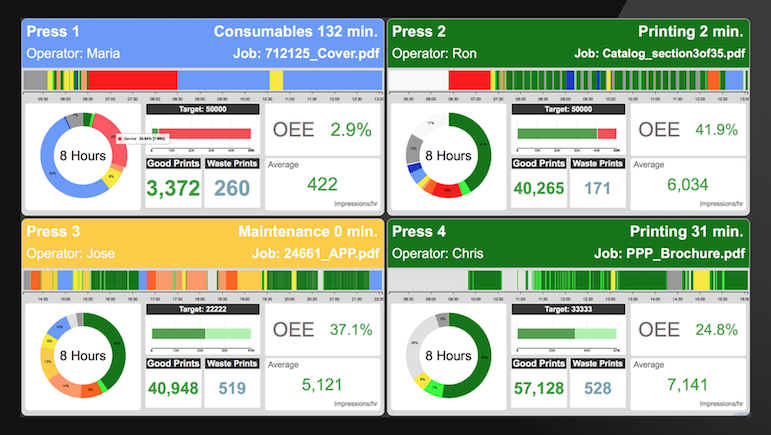
The real-time dashboard provides immediate visibility across the entire production floor, providing performance feedback to operators, production managers and supervisors. Know exactly when and why your equipment is not running. Set customizable production targets and compare in real-time for informative and proactive decision making.
The production dashboard helps you keep things on track and ensure that the deadlines are met. Real-time monitoring of KPIs and other useful metrics helps in identifying issues as they happen to facilitate immediate corrective actions. It promotes healthy competition and accountability within the team resulting in improved operational productivity and lower costs.
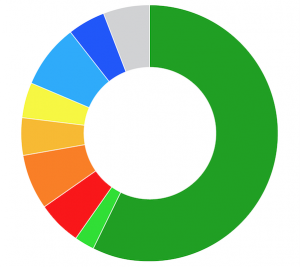
The donut chart shows an overview of the machines uptime and downtime activities. It can provide staff members with a quick, complete visual of shop floor operations.
The waterfall chart visualizes utilization and losses. It can provide management for example, a brief overview of capacity utilization, providing them with further insight for CapX, workload, or staffing decisions.
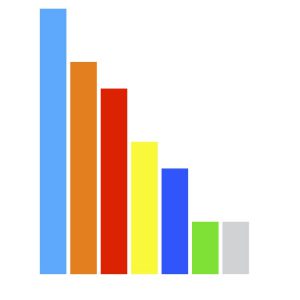
The Pareto chart displays which activities take the most downtime. It can quickly show a production manager for example, the exact activities consuming operational downtime, and intuitively explore whether they are expected or if a change is needed.
Reach out to our team and get started today