
By Jan Sierpe
Recap: Part 1 explored why production workers actively request more monitoring when given tools that support rather than surveil them. When real-time performance data flows directly to operators, curiosity replaces anxiety, and empowerment replaces fear.
Now let’s look at what happens one level up—how the same visibility transforms daily management operations.
The Problem Most Managers Won’t Say Out Loud
Production managers often spend their days as historians of failure. They arrive to discover what went wrong overnight, investigate why yesterday’s run underperformed, and explain last week’s quality issues to executives. They’re constantly operating on old information, trying to solve problems that have already cost money and eroded profit margins.
It’s exhausting, and it’s largely unnecessary.
The real frustration isn’t the problems themselves—those are inevitable in manufacturing. It’s the delay between when something goes wrong and when you can actually do something about it. By the time you know there’s an issue, the damage is done. All you can do is figure out what happened and hope to prevent it next time.
CONNECT changes that fundamental dynamic. Instead of discovering problems, you watch patterns emerge. Instead of investigating after the fact, you adjust in real-time.
What Real-Time Granularity Actually Means
Most monitoring systems capture the big picture: the press ran for eight hours, quality was acceptable, and some downtime occurred.
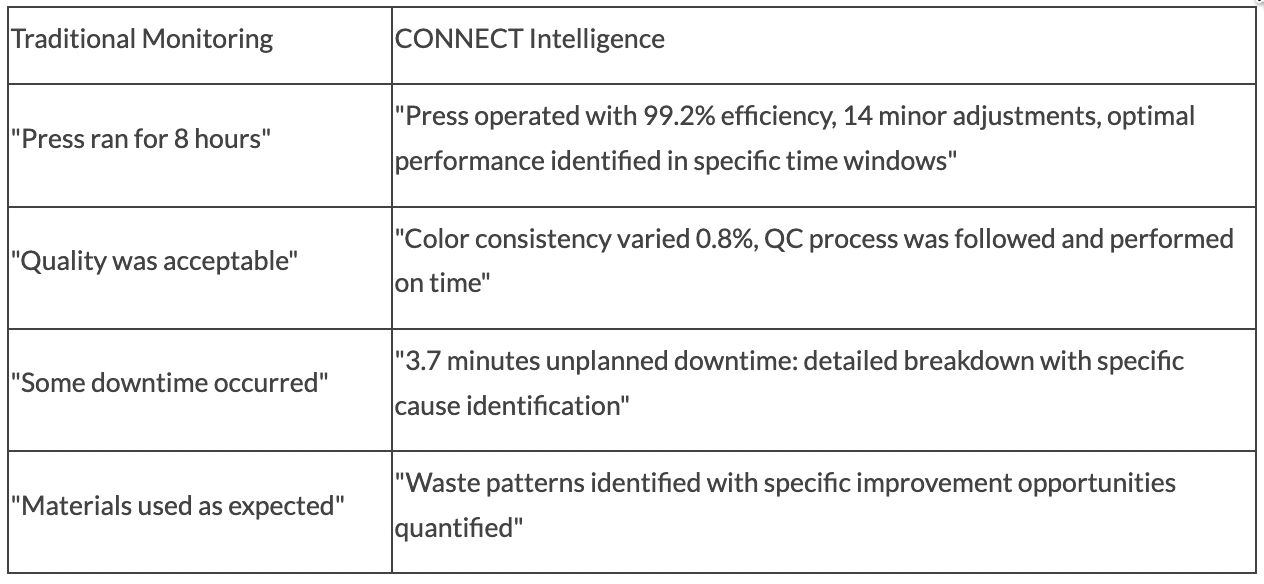
CONNECT captures what actually affects performance:
- The press didn’t just “run for eight hours.” It operated at 99.2% efficiency with fourteen minor adjustments. Performance peaked between 10:30 AM and 2:15 PM, then degraded slightly in the afternoon. The system logged exactly when each adjustment happened and what triggered it.
- Quality wasn’t just “acceptable.” Color consistency varied by 0.8% across the run, with specific patterns tied to substrate batch changes. Quality control checks happened on schedule, each documented with timestamps and results.
- “Some downtime” becomes 3.7 minutes of unplanned stoppage, with a detailed breakdown: 1.2 minutes for jam clearance, 1.8 minutes for a minor tension adjustment, and 0.7 minutes for a safety check. Each cause identified, each duration recorded.
- Material waste isn’t estimated from inventory counts or operator guesstimates; it’s tracked in real-time with identified patterns. You’re not discovering waste trends weeks later during inventory reconciliation. You’re seeing them develop and can intervene before they become expensive.
This level of detail sounds overwhelming. It would be, if humans had to process it all. But that’s not how CONNECT works.
Intelligent Processing vs. Data Overload
The system doesn’t dump raw data on managers. It identifies exceptions, recognizes patterns, and presents actionable information with clear visualization.
Instead of reviewing hundreds of data points, managers see:
- “Press three had print quality issues at 2:47 PM—investigating.”
- “Substrate consumption on Line 2 is 2.1% above normal for this job type—pattern suggests calibration adjustment.”
- “Morning efficiency consistently outperforms afternoon by 3.2%—environmental conditions may be a factor.”
The difference between raw data and processed intelligence is like the difference between being valuable and being overwhelming. CONNECT does the pattern recognition; managers make the decisions.
How Decision Speed Actually Changes
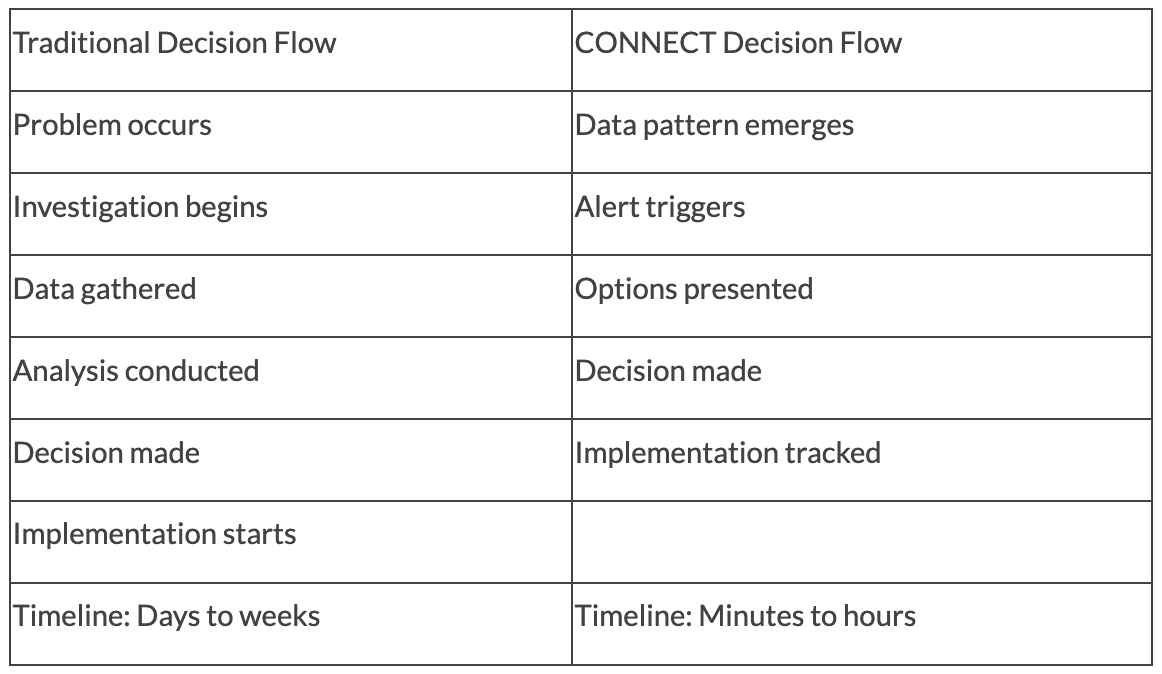
Traditional flow:
- Problem occurs
- Someone notices (eventually)
- Investigation begins
- Data gets gathered from various sources
- Analysis happens
- Options get discussed
- Decision made
- Implementation starts
Timeline: Days to weeks
CONNECT flow:
- Data pattern emerges
- System triggers an alert
- Manager reviews context
- Options presented based on similar historical situations
- Decision made
- Implementation tracked in real-time
Timeline: Minutes to hours
That compression of decision-making time is where productivity gains come from. Not from working faster or pushing harder—from cutting the lag between identifying an opportunity and acting on it.
What Multiple Facilities Really Need
If you’re running manufacturing operations across several locations, the challenge multiplies. Each plant has its own reporting style, its own data format, its own tribal knowledge about what the numbers really mean.
Getting a clear picture of overall performance involves calling each facility, collecting various types of information, attempting to normalize the data, and making decisions based on comparisons that aren’t quite apples-to-apples.
CONNECT provides unified visibility across all locations simultaneously:
Single dashboard access instead of calling each plant individually. Standardized metrics instead of translating between different reporting styles. Real-time performance comparison instead of time-delayed information gathering. Unified operational intelligence, instead of a fragmented picture you’re trying to assemble from pieces.
When a corporate manager can see real-time performance data from all facilities in a single view, patterns that were previously impossible to spot become visible. One plant consistently outperforms on certain job types—what are they doing differently? Another struggles with specific materials—can the knowledge from other locations help? These questions become answerable instead of speculative.
The Predictive Shift
Here’s where manufacturing intelligence moves beyond reactive problem-solving: predictive maintenance and proactive optimization.
When CONNECT tracks press speed variations, quality issues, substrate consumption rates, environmental conditions, and operator interactions across thousands of production runs, patterns emerge that weren’t visible in traditional reporting.
Certain combinations of conditions precede quality issues. Specific usage patterns precede equipment failures. Particular environmental factors correlate with changes in efficiency.
System alerts can recognize triggers and surface them before they become problems. Not “the bearing failed”—but “bearing vibration patterns suggest maintenance needed in next 72 hours.” Not “quality suffered on this run”—but “conditions developing that typically precede color consistency issues.”
This is the shift from managing problems to managing probabilities. You’re still making decisions, but you’re making them with better information at better times.
Industry Perspective
Bryan Llewellyn, Lead Digital Specialist at Printing Industries of America, described SpencerMetrics as “by far the superior product” with “great analytics.” That assessment comes from someone who evaluates manufacturing intelligence systems professionally and understands what actually delivers value versus what sounds good in demonstrations.
The recognition matters because it validates what clients experience: this approach works differently from traditional monitoring systems, and that difference shows up in operational results.
What Managers Actually Report
The consistent feedback across implementations isn’t about dramatic transformation stories. It’s about daily work becoming less frustrating:
Fewer surprises. Better ability to explain performance to leadership. Confidence in decisions instead of educated guesses. Less time investigating problems and more time optimizing processes. Easier conversations with customers about job status and delivery timing.
These might sound like modest improvements, but they compound. A manager who spends less time firefighting has more time for strategic planning. Better explanations of performance lead to more trust from leadership. Confident decisions based on data create better results than gut-feel choices made under pressure.
Over time, these minor improvements in daily operations accumulate into competitive advantages that are difficult for others to replicate. It’s not any single feature—it’s the accumulation of better decisions made consistently over months and years.
Coming in Part 3: How implementation actually works in real facilities, what the timeline looks like, and how to think about building competitive advantages that compound over time. We’ll also cover the practical aspects of integrating legacy equipment with modern systems and what happens as the data accumulates.