Every print operation has data, but is that data helping the business make money?
Modern production environments generate a constant stream of information from presses, inserters, finishing systems, workflow platforms, MIS systems, quality tools, and operator inputs. Counts, downtime, throughput, alarms, job status, waste, media usage, shift performance, machine utilization, and quality events are all part of the daily production story. Yet the move from “we have data” to “we know what to do next” is what separates a good operation from a great one.
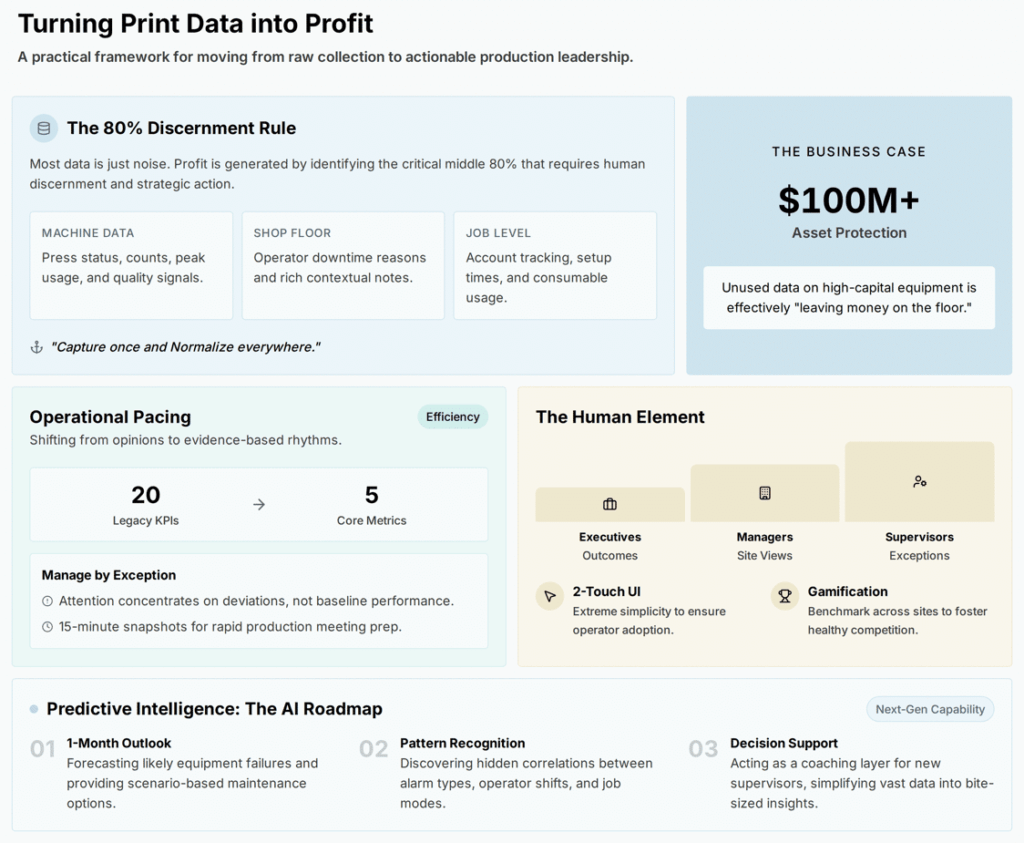
That distinction matters. Data by itself does not improve uptime, reduce waste, protect SLAs, or increase profitability. The most valuable signals are not always the most visible, and the data closest to hand is not always the data that explains profit. What helps you improve and optimize is Production Intelligence.
Not All Data Has Equal Value
In every print shop, there is essential data, low-value data, and a large middle layer that requires judgment. The challenge is not to collect everything. The challenge is to identify which signals explain where margin is being created, protected, or lost.
The most useful production intelligence usually begins with a practical set of questions:
- Where are machines available but not producing?
- Where is downtime caused by the machine, and where is it caused by workflow, materials, approvals, staffing, or scheduling?
- Which jobs consume more time, waste, or intervention than expected?
- Which operators, shifts, machines, or applications perform differently under similar conditions?
- Which quality events create rework, stoppages, or SLA risk?
Those questions point to the core categories every operation should understand: availability, uptime, downtime, waste, throughput, pacing, workflow, and risk. When these categories are measured consistently, they reveal the operating conditions that affect profit.
Capture Once, Normalize Everywhere
The print floor is rich and varied, and no single source of data tells the whole story. A press reports counts, status, media type, speed, alarms, and quality signals. An operator knows the machine is down because paper was not staged, a job was awaiting approval, or a downstream process was blocked. A workflow or job system holds the customer, application, SLA, quantity, job start and stop times, and the expected production path.
Three layers, three different perspectives:
Machine data provides precision. Operator context provides meaning. Job-level data provides business relevance.
When those three layers are connected, the operation moves beyond generic downtime reporting and begins to understand causes, effects, and financial impacts.
That is where the operating principle comes in: capture once, normalize everywhere. Different systems describe events in different ways. Different machines classify alarms differently. Different departments may define idle time, waste, or defects differently. A normalized production intelligence platform creates a common operating language — and lets leaders compare performance across machines, shifts, sites, job types, and vendors without forcing every system to behave the same way.
Operator Adoption Depends on Simplicity
Every successful data strategy starts with the shop-floor experience.
Operators are paid to keep production moving, so the data interface needs to respect that. Two-touch entry, short reason lists, and clean menus keep the focus where it belongs — on the press. Start with a small set of reasons for downtime. Add free-form comments for context. Expand granularity only after teams are comfortable with the process. Lights-out solutions like LYNK take this further by automatically capturing essential machine metrics with no operator effort.
Operators see the value quickly when data is used to improve staging, maintenance, scheduling, training, and workflow — when it makes their job easier, not harder. That is when adoption becomes self-sustaining.
AI Needs a Clean Foundation
AI is becoming a powerful tool for print production, and it performs best when the data underlying it is sound.
With accurate, structured, normalized data as the foundation, AI-powered analytics like CONNECT’s Q become genuinely useful — surfacing recurring downtime patterns, correlating alarms, summarizing shift performance, and eventually predicting likely failures or SLA risks before they happen. AI cannot fix bad data on its own, so the right sequence is essential:
- Collect accurate data.
- Structure it.
- Normalize it.
- Layer analytics and AI on top.
Done in that order, AI turns large datasets into practical insights for supervisors who do not have hours to study charts before a production meeting. It also opens the door to natural-language queries — managers asking “Which machine had the highest efficiency last month?” or “What caused the downtime on Press 3 last week?” — and getting useful answers in seconds, not days.
The Business Case Is Capital Return
That clean foundation is what turns production intelligence from a reporting exercise into a financial one.
Production intelligence is not a reporting project. It is a capital investment strategy. Print organizations invest millions of dollars in production assets, and every hour those assets are unavailable, underutilized, blocked by workflow, slowed by defects, or constrained by operator training represents unrealized return. Data exposes those opportunities and helps the business act on them before they become accepted as normal.
The dividend comes when leaders stop asking, “Did we get the work out?” and start asking, “How well did our operation convert available capacity into profitable output?”
That is the shift from data collection to production intelligence. And it is where print data becomes profit.